Difference between revisions of "Path Library Improvement Project"
| (3 intermediate revisions by the same user not shown) | |||
| Line 19: | Line 19: | ||
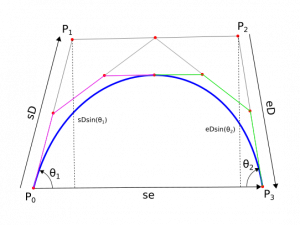
[[File:Bezier-splitting.png|thumb]] | [[File:Bezier-splitting.png|thumb]] | ||
The algorithm that livarot uses to decide how/if to split a cubic curve is slightly complex to understand. Therefore, I decided it would be best to explain it with the help of a picture. The cubic bezier shown in the picture is defined by two endpoints $\vec{P_{0}}$ and $\vec{P_{3}}$ and two control points $\vec{P_{1}}$ and $\vec{P_{1}}$. | The algorithm that livarot uses to decide how/if to split a cubic curve is slightly complex to understand. Therefore, I decided it would be best to explain it with the help of a picture. The cubic bezier shown in the picture is defined by two endpoints $$\vec{P_{0}}$$ and $$\vec{P_{3}}$$ and two control points $$\vec{P_{1}}$$ and $$\vec{P_{1}}$$. | ||
Now let us define three vectors: | |||
\begin{align}\vec{sD} = \vec{P_{1}}-\vec{P_{0}}\end{align} | |||
\begin{align}\vec{eD} = \vec{P_{3}}-\vec{P_{2}}\end{align} | |||
\begin{align}\vec{se} = \vec{P_{3}}-\vec{P_{0}}\end{align} | |||
Let us also define two scalar values: | |||
\begin{align}Sy = |\vec{sD}|\sin\theta_{1}\end{align} | |||
\begin{align}Ey = |\vec{eD}|\sin\theta_{2}\end{align} | |||
$$\vec{sD}$$ is a vector from the first end point to the first control point, similarly, $$\vec{eD}$$ is a vector from second control point to the second end point, $$\vec{se}$$ is a vector from the first end point to the second end point. $$Sy$$ and $$Ey$$ are the projections of the vectors $$\vec{sD}$$ and $$\vec{eD}$$ on the the axis perpendicular to the vector $$\vec{se}$$. | |||
This cubic bezier can be approximated by a line segment through its endpoints if the following three conditions are true: | |||
\begin{align}|\vec{se}| < 0.01\end{align} | |||
\begin{align}|3\vec{sD}|^2 < threshold\end{align} | |||
\begin{align}|3\vec{eD}|^2 < threshold\end{align} | |||
Or if the following four are true: | |||
\begin{align}|\vec{se}| >= 0.01\end{align} | |||
\begin{align}|3Sy| < threshold\end{align} | |||
\begin{align}|3Ey| < threshold\end{align} | |||
\begin{align}|\vec{se}| <= maxL\end{align} | |||
Otherwise, the bezier curve is split into two bezier curves as shown with colors magenta and green in the picture and then both are checked by the same conditions recursively. The center point (which is the common endpoint for both bezier curves) is added to the sequence of points. | |||
Latest revision as of 12:22, 14 June 2020
This wiki page will hold all extra documentation that I intend to write as I progress in the project.
The first functionality that I have succeeded to implement is Path Simplification.
Path Simplification
It is a two step process:
- Given a threshold value, break a path into line segments (we call this a polyline)
- Fit cubic bezier patches on the polyline such that the total error is controlled and the number of patches are kept minimum.
Breaking up into line segments
While this process can be very simple if we simply use lib2geom's Geom::Curve abstraction with a recursive path splitting algorithm. I think it's still better to use separate pieces of codes to deal with each type of curve separately. There are two advantages to doing this. Firstly, if you know the curve type, you can use a faster algorithm to do the splitting, secondly we can use the same path splitting algorithms as livarot does and have identical results.
At the moment, I have custom code to deal with Cubic Bezier curves and Line Segments (PathFlattener::breakLine and PathFlattener::breakCubic) and for every other type a generalized function PathFlattener::breakCurve is used.
Breaking Line Segments
Usually line segments aren't further broken at all. So only their endpoint is added to the sequence. However, if the flag convertEvenLines is set, we break the line into smaller line segments such that each line segment has a length that's smaller than or equal to the threshold. This is useful in Path Simplification.
Breaking Cubic Beziers
The algorithm that livarot uses to decide how/if to split a cubic curve is slightly complex to understand. Therefore, I decided it would be best to explain it with the help of a picture. The cubic bezier shown in the picture is defined by two endpoints $$\vec{P_{0}}$$ and $$\vec{P_{3}}$$ and two control points $$\vec{P_{1}}$$ and $$\vec{P_{1}}$$. Now let us define three vectors: \begin{align}\vec{sD} = \vec{P_{1}}-\vec{P_{0}}\end{align} \begin{align}\vec{eD} = \vec{P_{3}}-\vec{P_{2}}\end{align} \begin{align}\vec{se} = \vec{P_{3}}-\vec{P_{0}}\end{align} Let us also define two scalar values: \begin{align}Sy = |\vec{sD}|\sin\theta_{1}\end{align} \begin{align}Ey = |\vec{eD}|\sin\theta_{2}\end{align} $$\vec{sD}$$ is a vector from the first end point to the first control point, similarly, $$\vec{eD}$$ is a vector from second control point to the second end point, $$\vec{se}$$ is a vector from the first end point to the second end point. $$Sy$$ and $$Ey$$ are the projections of the vectors $$\vec{sD}$$ and $$\vec{eD}$$ on the the axis perpendicular to the vector $$\vec{se}$$.
This cubic bezier can be approximated by a line segment through its endpoints if the following three conditions are true: \begin{align}|\vec{se}| < 0.01\end{align} \begin{align}|3\vec{sD}|^2 < threshold\end{align} \begin{align}|3\vec{eD}|^2 < threshold\end{align}
Or if the following four are true: \begin{align}|\vec{se}| >= 0.01\end{align} \begin{align}|3Sy| < threshold\end{align} \begin{align}|3Ey| < threshold\end{align} \begin{align}|\vec{se}| <= maxL\end{align}
Otherwise, the bezier curve is split into two bezier curves as shown with colors magenta and green in the picture and then both are checked by the same conditions recursively. The center point (which is the common endpoint for both bezier curves) is added to the sequence of points.
